
Visualize Data With Soulpage Dashboards
Find The True Power Of Your Data With Our Dashboards
Gain New Analytics Experience From The Insights Generated
Transform your data reporting into rich and actionable data intelligence by trying out our dashboard examples with sample datasets and visualizations specific to your industry and requirements. Our dashboards are easy to use and deliver automated insights with great flexibility and functionality, thereby enabling you to make the best data-driven decisions with governed, secured, and trusted data.
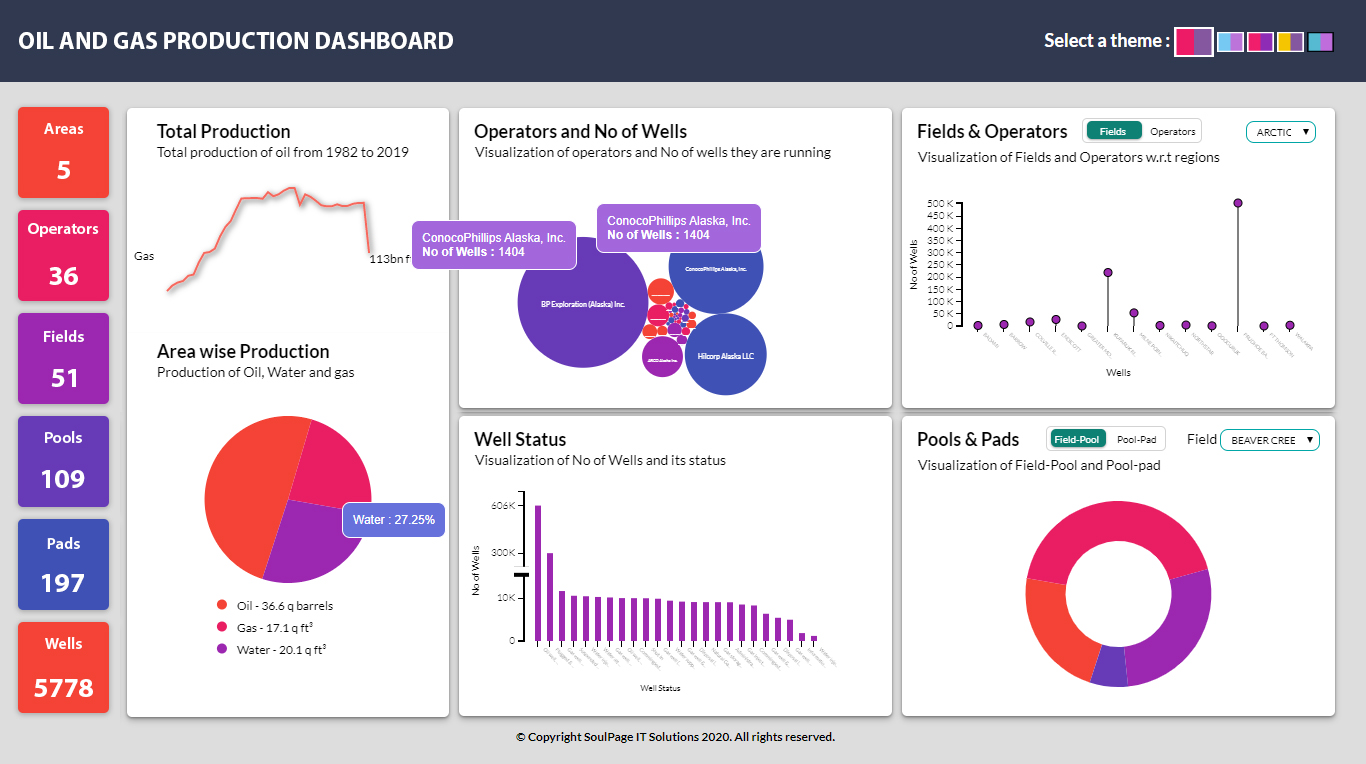
Oil & Gas Analytics
Our Oil & Gas analytics dashboard provides insights into the most important aspects of monitoring and control of oil production, wells, and operators. It provides real-time visibility and deep insights, along with forecasting, on the key performance indicators.
Leveraging this analytics dashboard not only enhances business operations but also provides real-time market insights to maximize product outcomes.
Our Data Analytics dashboards allows you to connect data from different systems, applications, and departments to identify trends, find correlations, and make better business decisions.
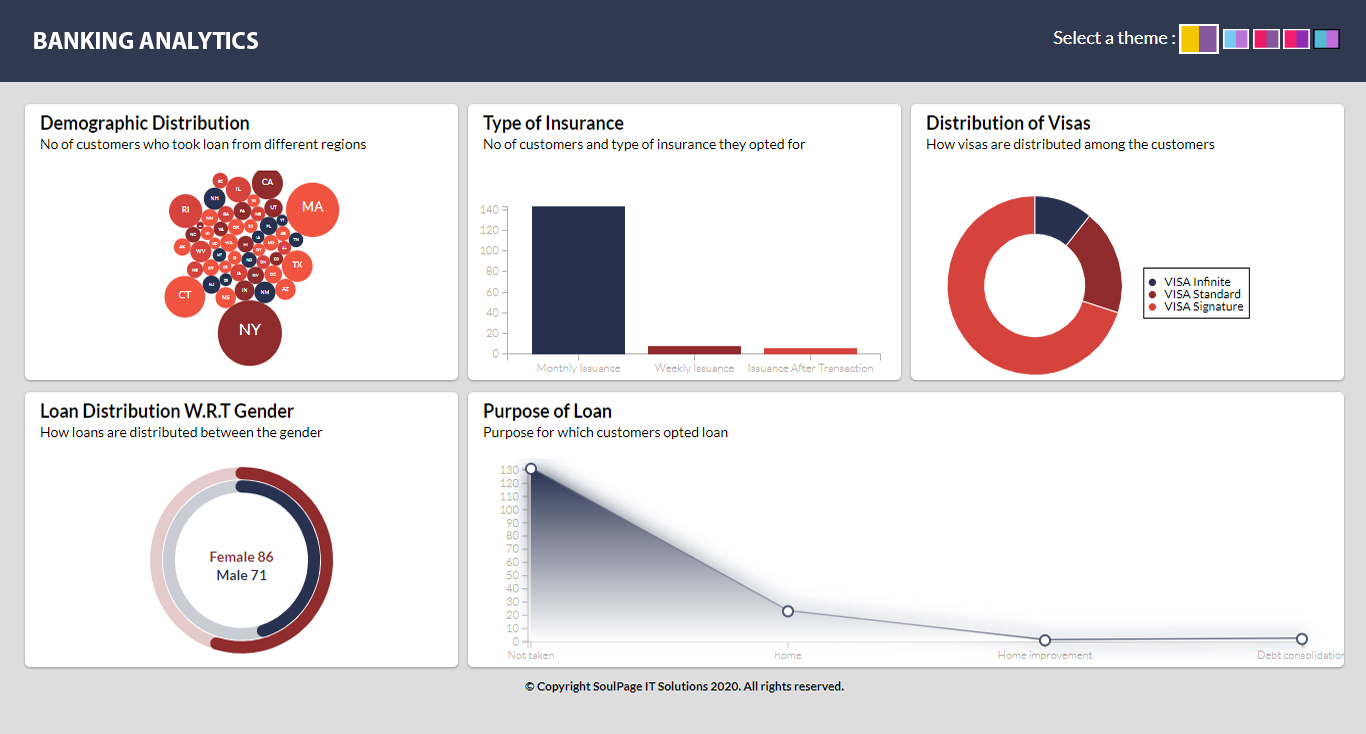
Banking Analytics
Our AI-driven dashboard helps provide a 360-degree view of the customers by performing loan and insurance analysis and prediction, customer analysis, fraud analysis, etc. The dashboard leverages advanced analytics techniques that help the banking sector to reduce risk and improve business outcomes.
Our Data Analytics dashboards allows you to connect data from different systems, applications, and departments to identify trends, find correlations, and make better business decisions.
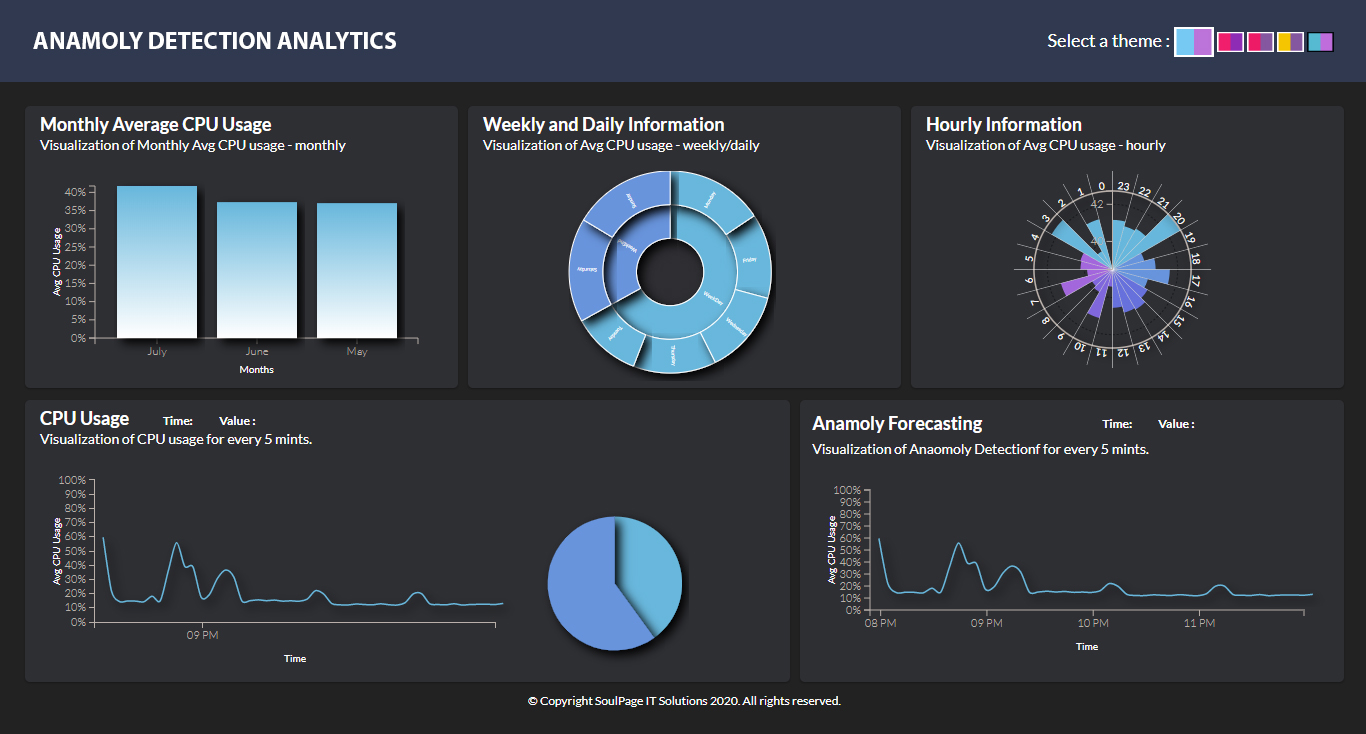
Anomaly Detection Dashboard
The dashboard uses an AI-based anomaly framework that measures the unusual highs and lows in the monitored critical metrics, CPU usage, response time, etc and generates insights that alert any unusual behaviors across the data.
Our Anomaly detection dashboard is renowned for its importance in fraud detection, health monitoring systems, event/alert triggering, etc.
Our Data Analytics dashboards allows you to connect data from different systems, applications, and departments to identify trends, find correlations, and make better business decisions.
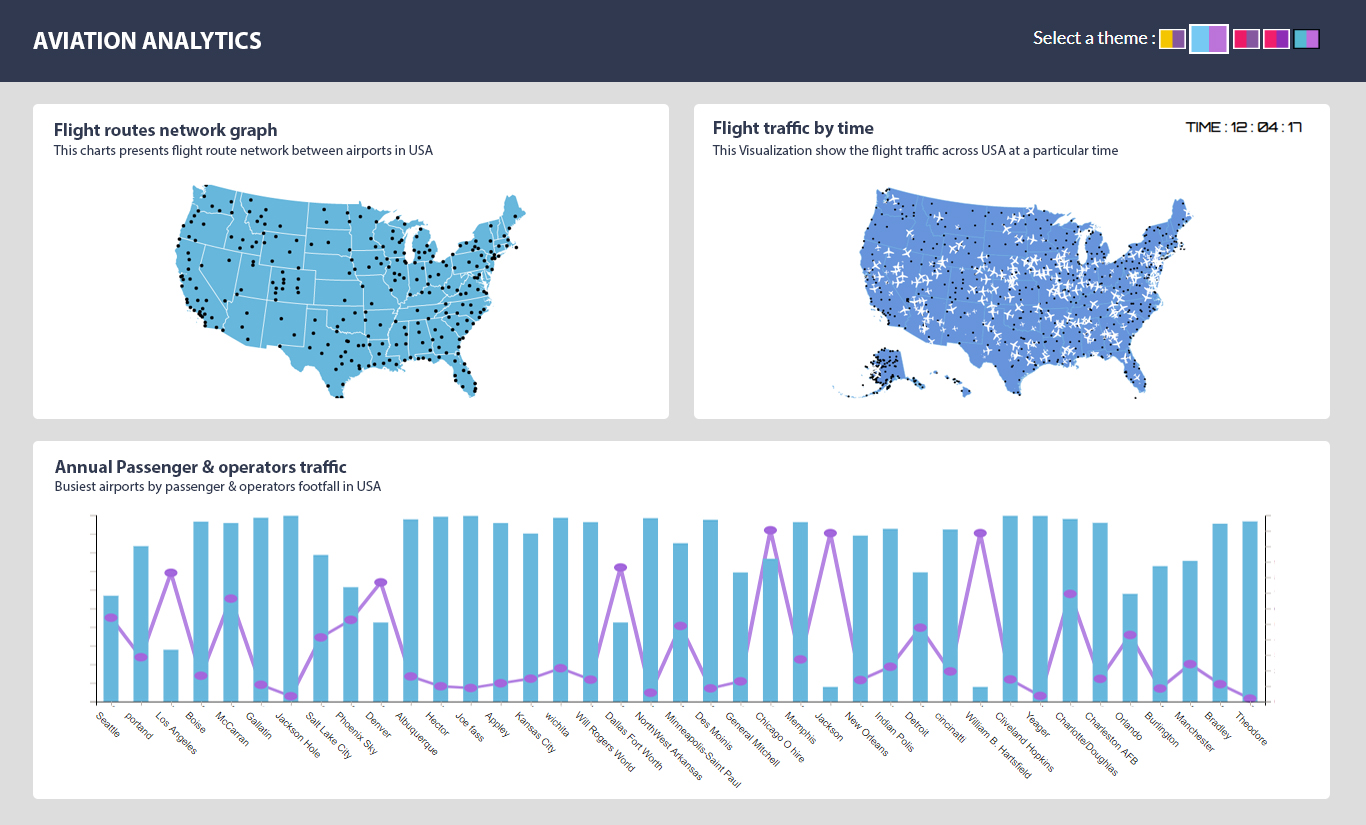
Aviation Analytics
Our dashboard analyzes and explores the industry trends, on-time performance, and the commercial viability of the airports. It gives historical data analysis and drives real-time data-driven actions that optimize the operations, reduces the flight delay time and the passenger wait time, etc.
This aviation analytical dashboard benefits CXOs, decision makers, and other key stakeholders in widening the opportunities and integrating technology for building a data-driven decision model.
Our Data Analytics dashboards allows you to connect data from different systems, applications, and departments to identify trends, find correlations, and make better business decisions.
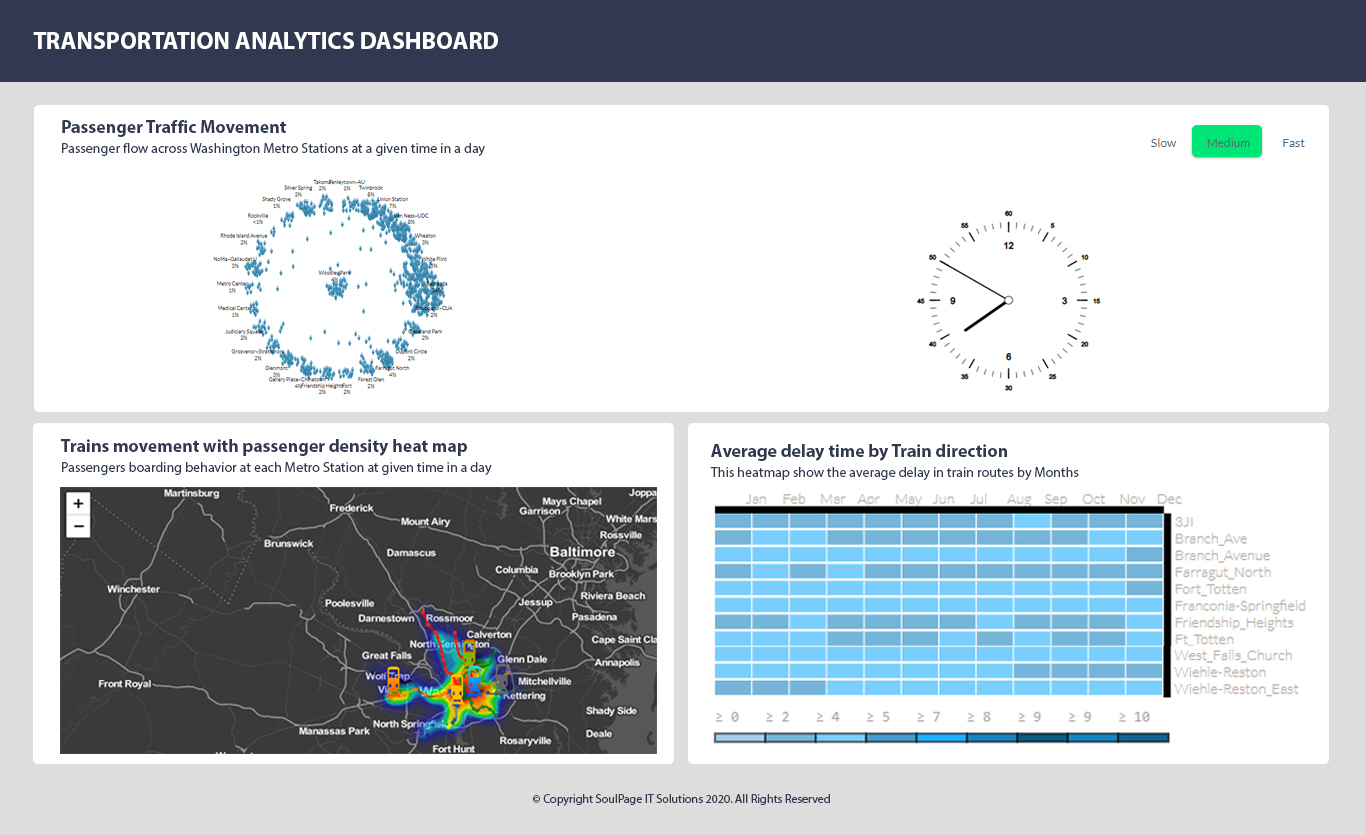
Transportation Analytics Dashboard
This dashboard facilitates real-time data analysis through which businesses can optimize their routes, measure the performance of their transport logistics, and minimize their costs. It provides actionable insights on the traffic movement, passenger boarding behaviors, the delays in the trains, etc.
Our dashboard provides incisive insights to prioritize business operations and fix critical challenges in advance by implementing technology at the core to monitor & measure transportation multi-data.
Our Data Analytics dashboards allows you to connect data from different systems, applications, and departments to identify trends, find correlations, and make better business decisions.
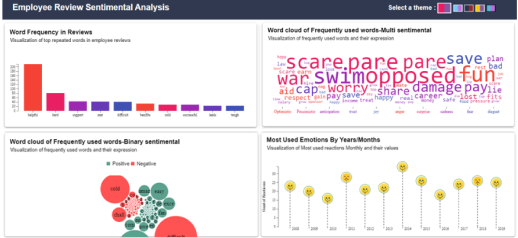
Sentiment Analytics
Our AI-based analysis system leverages text analytics techniques to interpret and classify the negative, positive, and neutral sentiments within the analyzed data set. Our sentiment analysis dashboard allows businesses to identify employee sentiments towards the organization, customer sentiments towards products, brands, or services in online feedback, and more.
The contextual mining of text by integrating NLP, text analytics, computational linguistics, OCR, and biometrics systemically identify the emotions behind the text and helps businesses in optimizing their operations at scale.
Our Data analytical dashboard allows you to connect data from different sources to analyze the sentiments of both internal and external customers in making better business decisions.
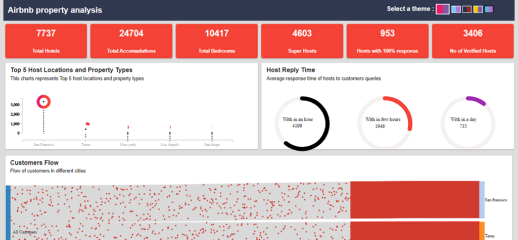
Airbnb Property Analysis
Our dashboard facilitates real-time data analysis to examine market demand and price fluctuations to measure the right price for a property to optimize your investment in a particular location. With our dashboard, you can analyze the top host locations, flow of customers in different cities, average host response time, and more.
AI-driven predictive analytics dashboard allows you to connect data from different sources, applications, and departments to identify trends, find correlations, and make better decisions through building a data-driven decision model.
Would you like to check out our dashboards and see how they can transform your data?
Fill in the details below